Tell us about the job
Takes about a minute. No obligation.
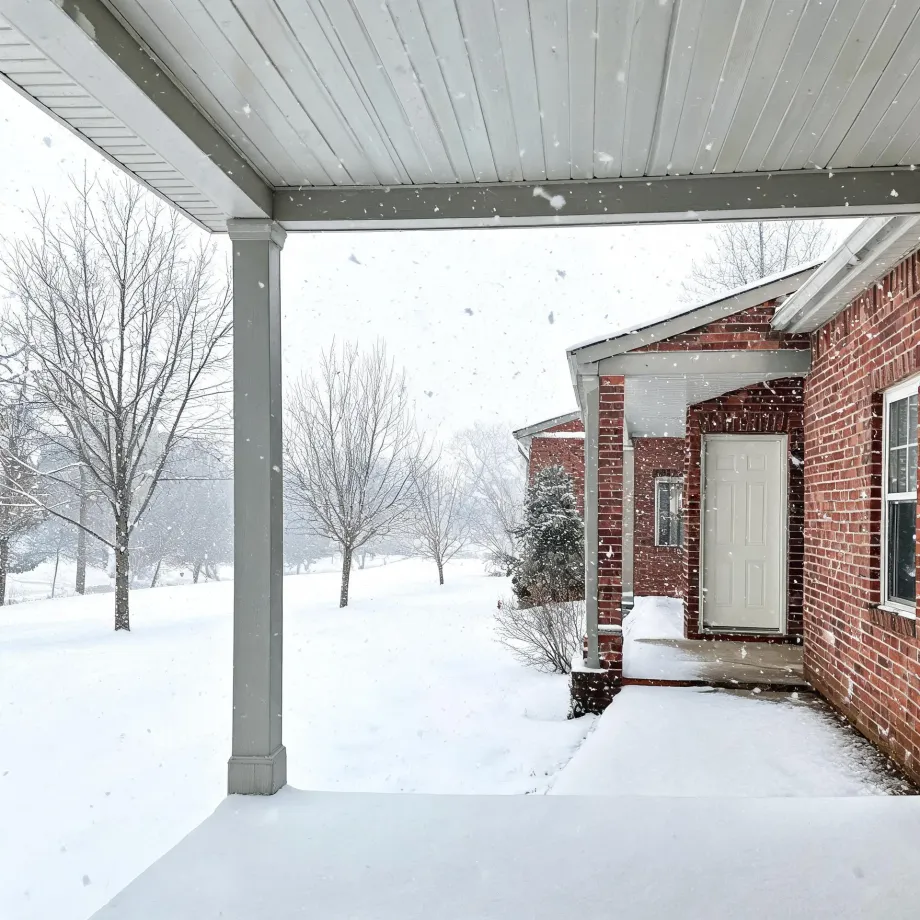
Sizing a heat pump for a Schoharie County house starts with what the heating season actually demands, and the answer here is unambiguous. Homes in Schoharie County, NY run heat about nine months a year, from September through May. A heat pump loses capacity as outdoor air temperature drops, so the coldest stretch of that long run is where an undersized system falls short, not in October but in January and February, when it matters most. A contractor has to establish what supplemental heat, if any, the installation needs to carry the load on those days, because the installed system will find out either way.
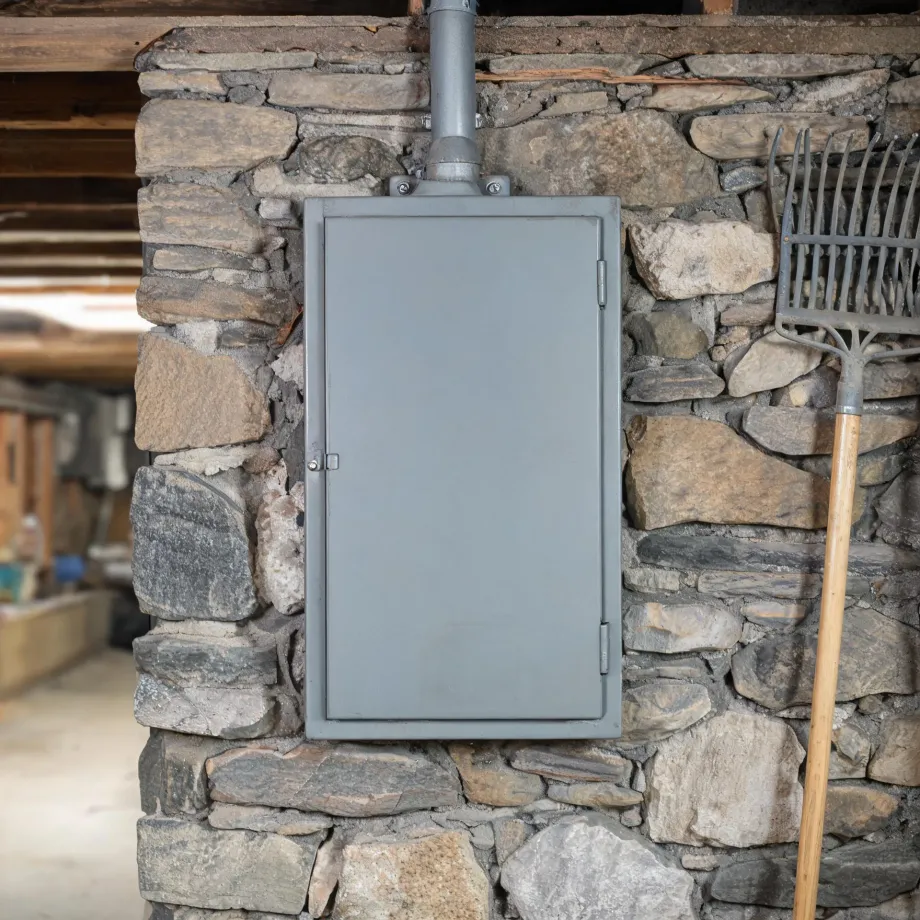
Ductwork laid out for an older heating system rarely aligns with what a heat pump needs, in terms of airflow, routing, or return capacity. Half the homes in Schoharie County, New York were built in 1974 or earlier (2020-2024 ACS 5-year). That means a contractor evaluating a heat pump installation here is looking at duct geometry that was built around different equipment entirely, and what they find in the walls and ceilings shapes the bid more than the unit itself does. A panel assessment comes alongside that, since the electrical service in houses of this vintage was not sized for the draw a heat pump carries.
What Gets Installed With a New Heat Pump
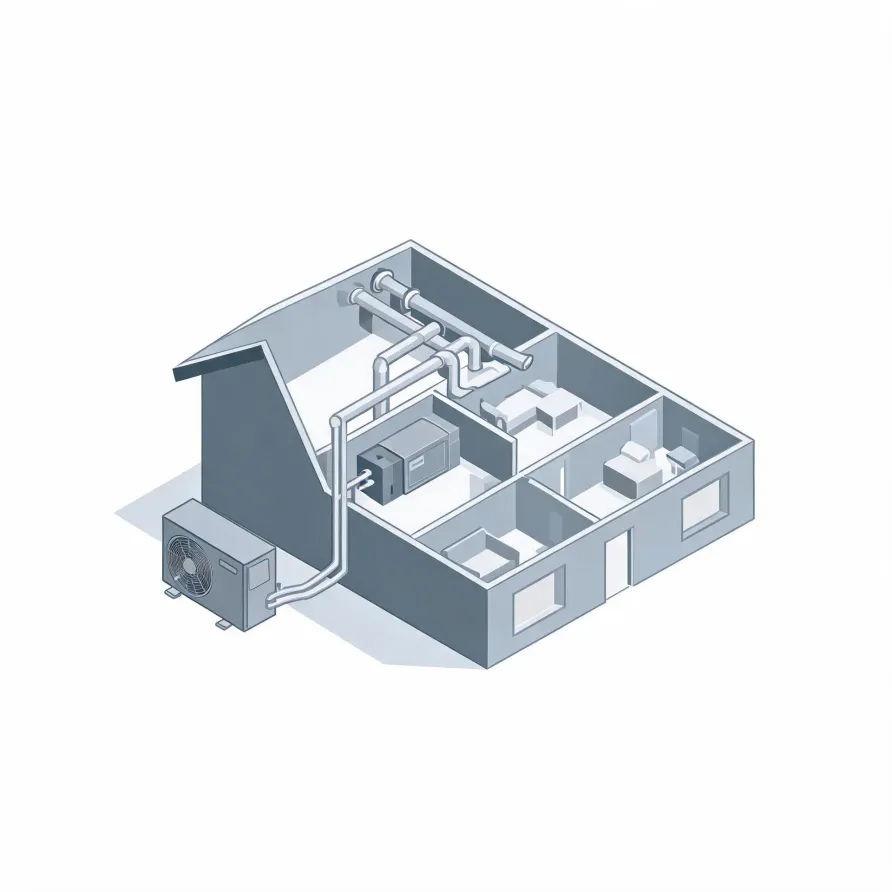
The outdoor unit is the piece a homeowner sees first, mounted on a concrete pad or wall bracket outside the house. Inside, an air handler or indoor coil sits in a utility space, basement, or closet and moves conditioned air through the home. Together these two units are the core of what a contractor puts in.
A refrigerant line set runs between the outdoor unit and the air handler, connecting the two through an exterior wall. A thermostat goes on an interior wall where it can read the living space accurately, and a condensate drain line carries moisture away from the indoor unit to a floor drain or outside.
The drawing shows a typical layout, and a licensed contractor determines exactly how each piece is positioned and routed in your home.
Get matched in Schoharie CountySchoharie County, by the numbers
167 severe weather events were recorded in Schoharie County, New York between 2015 and 2024.
NOAA National Centers for Environmental Information, Storm Events Database, bulk CSV export, events 2015-01-01 through 2024-12-31.Half the homes in Schoharie County, New York were built in 1974 or earlier (2020-2024 ACS 5-year).
U.S. Census Bureau, 2020-2024 American Community Survey 5-Year EstimatesSchoharie County, New York holds 16,562 housing units (2020-2024 ACS 5-year).
U.S. Census Bureau, 2020-2024 American Community Survey 5-Year EstimatesOwners occupy 76.4% of the occupied homes in Schoharie County, New York (2020-2024 ACS 5-year).
U.S. Census Bureau, 2020-2024 American Community Survey 5-Year EstimatesSevere Weather Events in Schoharie County
Heating and cooling equipment is sized and specified for the climate it has to handle. Weather stress on a home's envelope directly shapes how hard that equipment works and how long it lasts, which makes local weather history a real factor in any heat pump installation decision.
167 severe weather events, 2015–2024. Source: NOAA National Centers for Environmental Information, Storm Events Database.